Processing Large Unsplittable Files: A precursor to Big Data Processing

We often find ourselves in situations where we  have to process a file that has a much larger memory footprint than the machine on which you are running your processing. In those scenarios it isn’t feasible to load the entire data set in memory, as you would run into Out of memory issues. One way to solve the problem is vertical scalability, i.e throw more memory at the problem. But what if you don’t have the luxury of using more memory, yet you have to process this huge file.

Most of the distributed processing frameworks like Apache Spark or Flink are great at processing data that can be split and distributed across the nodes in a cluster.  However, if you have data that cannot be split, like a huge compressed file containing a giant block of data, then you are out of luck.

The approach that seems to work in this case is streaming. The idea is to read the file in, as a stream and then process bits and pieces without loading the whole file in memory. Lets look at some samples as to how we could accomplish this using Java or Scala. Similar techniques are available for other programming languages.

The use-case that we are going to deal with today is processing a giant array of JSONs that is gzipped together in a file. This is a fairly common use-case where some one would want to dump lots of data collected over time like clickstream, or visitor log, or product catalog into a file system for analytical needs.

The first step is to read this gzipped file and convert it into a stream:

public GZIPInputStream getGzipStream(String fileLocation){
    InputStream fileIs = null;
    BufferedInputStream bufferedIs = null;
    GZIPInputStream gzipIs =  null;
    try {
        fileIs = Files.newInputStream(Paths.get(fileLocation), new StandardOpenOption[]{StandardOpenOption.READ});
        // Even though GZIPInputStream has a buffer it reads individual bytes
        // when processing the header, better add a buffer in-between
        bufferedIs = new BufferedInputStream(fileIs, 65535);
        gzipIs = new GZIPInputStream(bufferedIs);
    } catch (IOException e) {
        closeSafely(gzipIs);
        closeSafely(bufferedIs);
        closeSafely(fileIs);
        throw new UncheckedIOException(e);
    }
    return gzipIs;
}

private static void closeSafely(Closeable closeable) {
    if (closeable != null) {
        try {
            closeable.close();
        } catch (IOException e) {
            e.printStackTrace();
        }
    }
}

As you can see above, we opened the gzipped file and are reading it in as a stream. The next step, we know that it contains an array of JSONs. Lets use GSON to read this array in a streaming fashion and process the JSONs sequentially:

public boolean readGzipStreamAndWriteToFile(GZIPInputStream gzipInputStream){
    try {
        JsonReader reader = new JsonReader(new InputStreamReader(gzipInputStream));
        Gson gson = new GsonBuilder().create();

        // Read file in stream mode
        reader.beginArray();
        int recordCount = 0;
        StringBuilder sb = null;
        String demarcator = "";
        while (reader.hasNext()) {
            // Bucketing policy, make buckets of size X and buffer write or do something.
            if(recordCount % MAX_RECORD_COUNT_IN_BUCKET == 0 ){
                if(sb != null &&  0 != sb.length() ){
                    FileSystemWriter.getInstance().writeToFile(String.valueOf(recordCount),sb.toString());
                }
                sb = new StringBuilder();
                demarcator = "";
            }

            JsonObject record = gson.fromJson(reader,JsonObject.class);
            sb.append(demarcator);
            demarcator = "\n";
            sb.append(record.toString());
            recordCount++;
        }
        // Process Items That are lesser than bucket size
        if(sb != null && 0 != sb.length() ){
            FileSystemWriter.getInstance().writeToFile(String.valueOf(recordCount),sb.toString());
        }
        reader.close();
    } catch (IOException ex) {
        ex.printStackTrace();
        return false;
    }
    return true;
}

In the above code fragment, we read a GzippedInputStream and use GSON’s JSON reader to read the array of JSON’s and carried on with our simple processing. We used a bucketing strategy to bucket the huge JSON into smaller buckets of processed data.

This code was tested on a 1GB compressed gzipped file, which on inflation blows up to about 10GB of data. The file was processed on a machine with 2GB heap space set . The processing time was less than 4 minutes. Most of the memory was consumed not for processing the giant file, but for maintaining the buffer before writing it out. If more memory could be provisioned, we could create larger buckets, in turn resulting in fewer IOPS and faster processing.

I hope this will be useful to someone dealing with similar problems and having limited resources at disposal. You can find the entire source code here.

Spring Actuator Cloudwatch

High availability, scalability, fault tolerance , robustness are no longer nice things to have but have become fundamental core principles of any reliable web application. Telemetry ( logs and metrics ) plays a very important role not only to help us react faster to any issues brought up , but also to help setup proactive counter measures to foreseeable future problems.

This post is relevant to web applications that make use of the popular Spring-boot  framework for development and run the application on AWS. Spring boot provides a very niche solution to host and expose several key metrics regarding your application at run time using spring-actuator project. You can take a look at all the data points that this library exposes here.  You can access all of this information by hitting the /metrics endpoint. However if you want to publish these metrics to some centralized place where you can visualize them, set up alerting and trigger automated actions based off certain threshold violations, then AWS cloudwatch is the monitoring solution to have.

Now normally integrating your application to AWS cloudwatch is very easy, however it needs some level of boiler plate code and repetitive tasks. Publishing data points from spring metrics to cloudwatch on regular intervals also requires some setup work.

Spring Actuator Cloudwatch is a very light weight library that tries to solve these problems and provides a very seamless easy integration of spring boot metrics with AWS cloudwatch.

Here is what you would have to do:

  1. Add the library:
<dependency> 
    <groupId>com.kajjoy.spring.devops</groupId> 
    <artifactId>cloudwatch-metrics</artifactId>
    <version>1.1</version> 
</dependency>

2. Have your spring applications scan for the 2 beans:

com.kajjoy.spring.devops.cloudwatchmetrics.publisher.CloudWatchPublisher
com.kajjoy.spring.devops.cloudwatchmetrics.service.CloudWatchService

3. Register two necessary beans to provide permissions to post to your AWS accounts:

@Bean
    public ClientConfiguration clientConfiguration(){
        ClientConfiguration config = new ClientConfiguration();
        config.setProxyHost(proxyHost);
        config.setProxyPort(proxyPort);
        return config;
    }

   @Bean
    public AWSCredentialsProvider credentialsProvider(){
        return new CredentialProviderChain();
    }

4. Now add configuration properties on your application.properties file:

spring.operational.metrics.cloudwatch.publish.cron=*/10 * * * * *
aws.cloudwatch.region=us-west-2
actuator.metrics.to.publish=mem.free,heap.used,threads.totalStarted
actuator.metrics.units=Kilobytes,Kilobytes,Count
cloudwatch.namespace=spring-actuator-cloudwatch

You can configure the following using these properties:

  • How often do you want to post these metrics, defaults to every 10 seconds.
  • Whats your AWS Cloudwatch region, defaults to us-west-2
  • Which all metrics you want to publish, defaults to memory and heap space utilized and active thread count.
  • What are the units for the metrics you want to publish. Acceptable values are:
Valid Values: Seconds | Microseconds | Milliseconds | Bytes | Kilobytes | Megabytes | Gigabytes | Terabytes | Bits | Kilobits | Megabits | Gigabits | Terabits | Percent | Count | Bytes/Second | Kilobytes/Second | Megabytes/Second | Gigabytes/Second | Terabytes/Second | Bits/Second | Kilobits/Second | Megabits/Second | Gigabits/Second | Terabits/Second | Count/Second | None
  • Custom name space where you would want to publish these metrics to.


And that’s it. All the metrics that you choose to publish will be published to cloud watch where you can seamlessly create dashboards, setup cloudwatch alarms and trigger actions using AWS lambdas to correct the problems automatically.

Let me know your comments and suggestions and feel free to make contributions to extend this library or make it better 🙂

Auto Error Retry a.k.a autoerroretry

One of the most commonly recurring pattern in developing data processing pipelines is the necessity to retry transient failures and a need to gracefully handle bad data. Given that this is a recurring pattern. I recently authored an open-source library autoerrorretry ( https://github.com/dipayan90/autoerroretry )  that provides a neat solution to this need.

The solution provides clean intuitive interface to achieve retrying of business logic  which is totally customizable along with a retry functionality whose frequency is user driven. More over this solution is completely asynchronous and the retry logic is handled by a background daemon.

The solution comes out of the box to support Amazon SQS, Apache Kafka, Square Tape ( a file based queuing mechanism ) . The solution also provides easy interfaces that helps abstract out the core problem and implement custom solutions.

To start with, you can get this library which is a java jar using maven:

<dependency>
 <groupId>com.nordstrom.ds</groupId>
 <artifactId>autoerroretry</artifactId>
 <version>1.3</version>
 <type>pom</type>
</dependency>

You can also use IVY and Gradle for the same.

Now that you have the library, how do you use it. Well, actually its pretty simple:

All the objects are serialized and de-serialized using a String serializer. The library comes out of the box with converters to help you out with this. ObjectStringConverter helps you to convert any given java object to a String.

Example:

Transaction transaction = new Transaction();
        transaction.setDate("12/27/1990");
        transaction.setTransactionId(1);
        transaction.setValue(100);
        
 String s = converter.toString(transaction);
  
 List<String> messageList = Collections.singletonList(s);

Now that we have converted it to a string, all the bad data that needs a second look can be moved to a deadletter queue or an error queue using:

LoaderHandlerClient client = new LoaderHandlerClient();
client.publishErrors(new PublishErrorMessageRequest. PublishErrorMessageRequestBuilder() 
.withMessages(messageList) .withMessageBroker(MessageBroker.SQS) 
.withSqsUrl(queueUrl)
.build());

As you can see the mandatory parameters are your objects that have bad data issues, an indication as to what type of backend message broker you want to use, in this case since we are using SQS we have to provide the global SQS url with it.

Retries have a very similar interface as errors, all you have to do is call publishRetries method instead of publishErrors.

For a kafka based backend you would use:

client.publishRetries(new PublishErrorMessageRequest.
                PublishErrorMessageRequestBuilder()
                .withMessages(messageList)
                .withMessageBroker(MessageBroker.KAFKA)
                .withKafkaRetries(0)
                .withKafkaServers(Collections.singletonList("localhost:9092"))
                .withKafkaTopic("retry")
                .withOrderGuarentee(true)
                .build());

Similarly for a simple file based backed you can use:

client.publishRetries(new PublishErrorMessageRequest.
                PublishErrorMessageRequestBuilder()
                .withMessages(messageList)
                .withMessageBroker(MessageBroker.TAPE)
                .withTapeFileName("tape.txt")
                .build());

Good use cases of retries would be transient database unavailability, I/O errors due to network issues, failure of preceding steps in a chain of steps and so on. The best way to do see what to retry would be to cat exceptions on your processing functions and call this retry routine or get a list of failed messages as a result from your processing functions and adding them to the queue. The process of sending retriable messages in non blocking and is handled by a background thread which will not stop your chain of execution.

Handling retirable objects

Now that we know what to retry and how to publish retriable messages, lets see how do we handle retriable messages. Turns out that even that is quite simple. All you got to do is pass your business logic that needs to be retired on the objects.

A simple example would be:

client.recieveRetires(new ReceiveErrorMessageRequest
                .ReceiveErrorMessageRequestBuilder()
                .withSqsUrl(queueUrl)
                .withPingInterval(5)
                .build(), strings -> {
            strings.forEach(e -> { System.out.println(converter.fromString(e)); });
            return null;
        });

Please not that the input function to this method takes a list of strings that first needs to be converted to the native object. ObjectStringConverter to the rescue, which has a small utility method to convert Strings back to your object. Whatever business logic/function that you pass as an argument to the method call will be executed on your native object. In the example above, we are passing a function that just prints stuff. We can use this to save our native objects to a database, send it to another stream based system and so on. Again this is also non blocking and is processed by a background daemon. Please take a look at readme for more details on how other message brokers like kafka and tape are supported.

Please note , if the function execution fails on the retriable objects you can either discard the message by sending it to the erro queues or push is back to be retired again.

Hope this small light weight library helps solve some of your commonly recurring issues. Let me know your comments on this. Persistence is the key 🙂 .

Kubernetes For Beginners : Get up and running in minutes

Over the last couple of years there has been a tremendous momentum towards dev-ops. Developers/Engineers are expected to not only code, but take care of deployments, monitoring, alerting and running applications on a scale. The tradition of saying that code runs on my box just doesn’t cut any more.

There have been several open source projects that have come up in the recent years that help you to run your application at scale, load balance the traffic, take care of fault tolerance and provide automated monitoring solutions. Containerization technologies like docker and rkt have been game changers in shifting the paradigm towards platform agnostic deployments. You no longer need to install 10 different things on your box to run your code when you can package all of the dependencies together and run anywhere. Container orchestration tools like docker swarm (https://docs.docker.com/engine/swarm/ ) , coreOs ( https://coreos.com/ ) and kubernetes ( https://kubernetes.io/ ) have really made a significant impact on how we manage our applications on a cluster in a robust and reliable manner. This article is going to demonstrate how you can get started with kubernetes in a matter of minutes, provided you have your application ready and running locally. I primarily work on java/spring-boot based applications, so I will use that as a baseline application here, but it doesn’t have to be a java application.

Step 1: Clone Sample Spring boot project from github

git clone https://github.com/dipayan90/webcrawler.git

Step 2: Run App Locally

mvn spring-boot:run

You should see a simple Spring boot web application startup, which you can use locally by going to http://localhost:8080 or access its health endpoint by going to http://localhost:8080/health

Step 3: Look at the Dockerfile

vi Dockerfile

Look at the contents, where is a simple java application that runs on 8080 port leveraging spring-boot’s embedded tomcat instance.

Step 4: Build, Run and Publish the Docker Image to a Central Docker Repository ( in this case docker hub)

Pre-requisite for this step is that you should have docker installed on your machine. This is however optional, since for this demo we will pull a docker image off the internet.

Build the image:

docker build -t webcrawler .

Run the image:

docker run -p 8080:8080 -it webcrawler

Once it runs successfully, push the image using docker login and docker push ( https://docs.docker.com/docker-cloud/builds/push-images/ )

In our case we already have this image on docker hub: https://hub.docker.com/r/dipayan90/webcrawler/

Step 5: Install Virtualbox

We will be setting up a standalone kubernetes cluster that will run on local VM, so virtual box is go to choice for this, installation instructions can be found here: https://www.virtualbox.org/wiki/Downloads

Step 6: Install Kubectl – Command line client to access the kubernetes resources and the cluster

Installation instructions can be found here:  https://kubernetes.io/docs/tasks/tools/install-kubectl/

Step 7: Install minikube ( Standalone kubernetes cluster )

Installation instructions can be found here: https://github.com/kubernetes/minikube/releases 

Step 8: Start minikube locally

if you are directly connecting to the internet without any proxy, you can do:

minikube start

else if there is a corporate proxy involved:

minikube start --vm-driver="virtualbox" --docker-env="http_proxy=proxyHost:proxyPort" --docker-env="https_proxy=proxyHost:proxyPort"

Once it has started you can check the status of the cluster by:

minikube status

you should see the following output:

minikubeVM: Running
localkube: Running

You can alternatively do :

kubectl cluster-info

you should see the following output:

Kubernetes master is running at https://192.168.99.100:8443

Now that you have installed and checked that kubernetes standalone installation is successful, you can ssh into the VM by:

ssh docker@$(minikube ip) with password tcuser

Step 9:  Deployment.yaml – a closer look

Open the webcrawler/k8sresources/deployment.yaml  of the project you just cloned. This is a standard kubernetes template configuration file.

Lines 1 – 4 specify the file metadata information about the file, like the unit version, type of unit ( in this case Deployment) and name of the unit ( webcrawler-deployment )

Lines 5 – 10 specify the scalability spec, like number of replicas you want ( 3 here ) , and the app name.

Line 10 – 16 specifies the container level spec, which specifies the image to be run ( remember we pushed our image to dockerhub before, here we import the image dipayan90/webcrawler ). We also specify the port that the app is exposing and also name the container.

You can now deploy this docker image :

kubectl create -f deployment.yaml

You just kicked off the deployment process, now if you do:

kubectl get pods -l app=webcrawler  or  kubectl get pod -owide

you should see that 3 pods ( https://kubernetes.io/docs/concepts/workloads/pods/pod/ ) have got created since we specified 3 as our replica set value.  You should also be able to see the IP’s where the app is running.

Now remember that these IP’s are for the VM on which the pods are running, so if you hit the IP’s from your machine you won’t be able to get the outcome on your browser. To see the output ssh into the VM ( instructions provided earlier ) and hit the IP’s. a quick test would be curl IP:8080/health should return the health check json.

To look at the config that kubernetes generates, you can do:

kubectl describe deployment webcrawler-deployment

Step 10: Service.yaml a closer look

Take a look at : webcrawler/k8sresources/service.yaml . This file is the one that binds all the 3 pods that we launched together. Now we had 3 IP’s on which our app was running. But its possible that one of the machines goes down due to some reason, kubernetes is automatically going to spin another pod and assign a new IP, now if our clients use the static IP’s then they will not be able to reach our service. The service unit defines the mapping between the pods and a singular IP that acts as a proxy for all the 3 instances.

Lines 1-5 is the metadata information. Lines 5-8 specifies the name of the app we are binding the service to. This name ( webcrawler ) should be same as the app name on our deployment.yaml. Line 8 – 11 specifies on which port the service should listen to from the containers ( 8080 in this case, since this is the container port that we exposed on the deployment.yaml ) and the port that the service unit is going to expose ( port 80 in this case) .

Now lets deploy the service unit by:

kubectl create -f service.yaml

Now if you do :

 kubectl get service -owide

you should be able to see the service unit deployed. Now do :

kubectl describe service webcrawler-service

You should see following :

Name: webcrawler-service
Namespace: default
Labels: <none>
Selector: app=webcrawler
Type: ClusterIP
IP: 10.0.0.159
Port: <unset> 80/TCP
Endpoints: 172.17.0.4:8080,172.17.0.5:8080,172.17.0.6:8080
Session Affinity: None
No events.

Now if you observe, our service file was able to tie to the 3 individual IP’s succefully, and also now has an individual IP listening on port 80.

However we will not be able to hit this IP and hit our app, since this is an internal IP to the kubernetes cluster. For more information about service files read this ( https://kubernetes.io/docs/concepts/services-networking/service/ ) . To hit the app from your local machine and access the data, next section is very important.

Step 11: Ingress.yaml – A closer Look

First enable ingress on the kubernetes cluster:

minikube addons enable ingress

This will kick start a Nginx ingress instance for you that will do the job of loadbalancing. It ships out of the box with your minikube installation.

Now that we have enabled that, what is ingress ? Ingress is the one that maps the internal service IP that we saw on our last step with a public DNS. Now if you dont have a public DNS, go and modify the /etc/host file:

echo "$(minikube ip) kajjoykube.com" | sudo tee -a /etc/hosts

Now that we have this mapping on our local system, lets look at the ingress.yaml file. Line 5-8 specify the host name. Lines 8 – 13 specify the service name that the ingress is going to map to , the port at which the service is listening and the path for the dns record where the traffic is going to be sent to . In this cas the path is /, so all requests to kajjoykube.com/ will be forwarded to the service IP address. However if the path was /foo then requests to kajjoykube.com/foo would have been forwarded to the app.

Now lets deploy the ingress.yaml file:

kubectl create -f ingress.yaml

You can see the ingress running on the cluster by:

kubectl get ingress -owide

Hit the kajjoykube.com/health or kajjoykube.com url from your machine’s browser and see that the end to end flow working with 3 instances receiving the traffic and nginx loadbalancing the traffic.

Hope this helps get you started with kubernates. This is a basic 101, there is a lot more in kubernetes than this, so keep reading more about it 🙂 Till then cya.

Apache Spark – A Closer Look

Undoubtedly one of the most famous big data processing libraries out there is Apache spark (http://spark.apache.org) . Apache Spark project started at UC Berkley and the first major release happened in 2014. Apache spark claims to be much faster than Hadoop (http://hadoop.apache.org) both while processing in memory or while running on disks. Apache spark provides an easy to use API for Java, Scala and Python.

The corner stone of Apache spark is RDDs ( Resilient Distributed Data set). The salient feature of RDDs is that the data is distributed across nodes in a fault tolerant fashion. All the big data operations ( maps, Reduces, Joins, Aggregates, Folds, Wraps etc. )  are performed on these RDDs. The spark ecosystem consists of:

  • Spark Core
  • Spark SQL
  • Spark Streaming
  • Spark Machine learning
  • Spark GraphX

In this blog we will be discussing the most common use cases that you may encounter using spark core and spark SQL. We will deal with rest of the modules in a dedicated blog post later.

Adding spark to your project : 

I generally use maven as the build tool. If you are using maven all you will need is :

<dependency>
  <groupId>org.apache.spark</groupId>
  <artifactId>spark-core_2.10</artifactId>
  <version>1.5.1</version>
</dependency>
<dependency>
  <groupId>org.apache.spark</groupId>
  <artifactId>spark-sql_2.10</artifactId>
  <version>1.5.1</version>
</dependency>
<dependency>
  <groupId>org.mongodb.mongo-hadoop</groupId>
  <artifactId>mongo-hadoop-core</artifactId>
  <version>1.5.1</version>
</dependency>

Now dependency 3 is not needed, but its just a connector that connects spark to MongoDB(https://www.mongodb.com/)
I am going to use it to demonstrate how spark connects to a data source easily. There will be connectors like this to
other data sources. 

Usage

The first and foremost thing that you will need is, to initialize the spark context.  I am running Spark along with a Spring app, so I am going to create a bean  for it:

@Bean
 public JavaSparkContext sparkContext(){
 return new JavaSparkContext("local[2]", "Aggregate Spark Jobs");
 }

Note: If you want to run more than 1 spark jobs on your project , you cannot instantiate multiple spark contexts. You will have to reuse the existing spark context.

Just on adding this, you may see some logs like this:

2016-08-29 16:13:35.950 INFO 86076 --- [ main] org.apache.spark.SparkContext : Running Spark version 1.5.1
2016-08-29 16:13:36.095 WARN 86076 --- [ main] org.apache.hadoop.util.NativeCodeLoader : Unable to load native-hadoop library for your platform... using builtin-java classes where applicable
2016-08-29 16:13:36.199 INFO 86076 --- [ main] org.apache.spark.SecurityManager : Changing view acls to: chattod
2016-08-29 16:13:36.200 INFO 86076 --- [ main] org.apache.spark.SecurityManager : Changing modify acls to: chattod
2016-08-29 16:13:36.201 INFO 86076 --- [ main] org.apache.spark.SecurityManager : SecurityManager: authentication disabled; ui acls disabled; users with view permissions: Set(chattod); users with modify permissions: Set(chattod)
2016-08-29 16:13:36.699 INFO 86076 --- [lt-dispatcher-2] akka.event.slf4j.Slf4jLogger : Slf4jLogger started
2016-08-29 16:13:36.732 INFO 86076 --- [lt-dispatcher-2] Remoting : Starting remoting
2016-08-29 16:13:36.871 INFO 86076 --- [lt-dispatcher-3] Remoting : Remoting started; listening on addresses :[akka.tcp://sparkDriver@139.126.184.245:51465]
2016-08-29 16:13:36.877 INFO 86076 --- [ main] org.apache.spark.util.Utils : Successfully started service 'sparkDriver' on port 51465.
2016-08-29 16:13:36.897 INFO 86076 --- [ main] org.apache.spark.SparkEnv : Registering MapOutputTracker
2016-08-29 16:13:36.911 INFO 86076 --- [ main] org.apache.spark.SparkEnv : Registering BlockManagerMaster
2016-08-29 16:13:36.933 INFO 86076 --- [ main] o.apache.spark.storage.DiskBlockManager : Created local directory at /private/var/folders/18/hbm7trx518z_f6dhsndc2h00521fhz/T/blockmgr-2f38c5c0-d4e7-4892-bb12-eeeb5aecd059
2016-08-29 16:13:36.947 INFO 86076 --- [ main] org.apache.spark.storage.MemoryStore : MemoryStore started with capacity 1966.1 MB
2016-08-29 16:13:36.989 INFO 86076 --- [ main] org.apache.spark.HttpFileServer : HTTP File server directory is /private/var/folders/18/hbm7trx518z_f6dhsndc2h00521fhz/T/spark-0477e6a6-c3c2-43b4-8e32-20a2fe9c31c6/httpd-93aa240c-4c54-486a-99e3-f174f9ca81b3
2016-08-29 16:13:36.991 INFO 86076 --- [ main] org.apache.spark.HttpServer : Starting HTTP Server
2016-08-29 16:13:37.044 INFO 86076 --- [ main] org.spark-project.jetty.server.Server : jetty-8.y.z-SNAPSHOT
2016-08-29 16:13:37.058 INFO 86076 --- [ main] o.s.jetty.server.AbstractConnector : Started SocketConnector@0.0.0.0:51466
2016-08-29 16:13:37.059 INFO 86076 --- [ main] org.apache.spark.util.Utils : Successfully started service 'HTTP file server' on port 51466.
2016-08-29 16:13:37.071 INFO 86076 --- [ main] org.apache.spark.SparkEnv : Registering OutputCommitCoordinator
2016-08-29 16:13:37.153 INFO 86076 --- [ main] org.spark-project.jetty.server.Server : jetty-8.y.z-SNAPSHOT
2016-08-29 16:13:37.160 INFO 86076 --- [ main] o.s.jetty.server.AbstractConnector : Started SelectChannelConnector@0.0.0.0:4040
2016-08-29 16:13:37.160 INFO 86076 --- [ main] org.apache.spark.util.Utils : Successfully started service 'SparkUI' on port 4040.
2016-08-29 16:13:37.162 INFO 86076 --- [ main] org.apache.spark.ui.SparkUI : Started SparkUI at http://139.126.184.245:4040
2016-08-29 16:13:37.220 WARN 86076 --- [ main] org.apache.spark.metrics.MetricsSystem : Using default name DAGScheduler for source because spark.app.id is not set.
2016-08-29 16:13:37.223 INFO 86076 --- [ main] org.apache.spark.executor.Executor : Starting executor ID driver on host localhost
2016-08-29 16:13:37.410 INFO 86076 --- [ main] org.apache.spark.util.Utils : Successfully started service 'org.apache.spark.network.netty.NettyBlockTransferService' on port 51468.
2016-08-29 16:13:37.410 INFO 86076 --- [ main] o.a.s.n.netty.NettyBlockTransferService : Server created on 51468
2016-08-29 16:13:37.411 INFO 86076 --- [ main] o.a.spark.storage.BlockManagerMaster : Trying to register BlockManager
2016-08-29 16:13:37.414 INFO 86076 --- [lt-dispatcher-3] o.a.s.s.BlockManagerMasterEndpoint : Registering block manager localhost:51468 with 1966.1 MB RAM, BlockManagerId(driver, localhost, 51468)
2016-08-29 16:13:37.415 INFO 86076 --- [ main] o.a.spark.storage.BlockManagerMaster : Registered BlockManager
2016-08-29 16:13:37.515 INFO 86076 --- [ main] c.c.d.i.e.I.DaySupplyAggregatorITTest : Started DaySupplyAggregatorITTest in 1.915 seconds (JVM running for 6.965)

Now that you have spark up and running, lets dive into how we can get stuff into our app using spark.

Connecting to source:

Now I am using Mongo hadoop (https://github.com/mongodb/mongo-hadoop) connector to connect to my mongo instance. If you remember we added this as a dependency to our project.

All you got to do to get data is:

JavaPairRDD sparkRDD =  sparkContext.newAPIHadoopRDD(config, MongoInputFormat.class,Object.class, BSONObject.class);
where config is:
 org.apache.hadoop.conf.Configuration mongodbConfig = new org.apache.hadoop.conf.Configuration();
 mongodbConfig.set("mongo.job.input.format",
 "com.mongodb.hadoop.MongoInputFormat");
 mongodbConfig.set("mongo.input.uri", "mongodb://"+mongodbHost+"/"+database+"."+aggregateSalesCollection);
 mongodbConfig.set("mongo.input.query",getMongoQuery());

This is now going to get data from mongo using whatever mongo query we pass to it. As you can see we have the mongo result now stored on an RDD which may be distributed across multiple node. Similarly you can just read a log file by specifying a location. Connect to Oracle databases using a spark JDBC driver, so on and so forth.

Spark Operations on RDDs

There are 2 types of RDD operations:

  • Transformation – New datasets are created after performing some operations on existing dataset.
  • Actions: Spark driver returns data after performing transformation on the data.

Spark lazy loads transformation. By that what I mean is suppose you do an aggregation or a group-by on a spark RDD, the transformation doesn’t take place instantly, instead spark remembers what operations it has to perform and then when any action is called it completes all transformations and returns result.

Most used transformation operations are:

  • Map
  • Group-By
  • Join
  • Filter
  • Sort
  • Distinct.

Most commonly used Action operations are:

  • Reduce
  • Collect
  • For-each
  • Save

Now that we know what operations can be performed lets look into some more code.

Suppose we are storing documents in this format:

{
 "firstName" : "dipayan"
 "lastName" : "chattopadhyay"
 "city" : "Seattle"
 "phone" : "12398760"
 "jobtitle" : "developer"
}

Now suppose we want to find out phone numbers of people with the same first name who reside in Seattle. And you want to perform this operation on Spark, you can do something like:

//sparkRDD is a javaPairRDD, but we are interested in the values, so we can do
JavaRDD<Person> seattlePeople = sparkRDD.values().filter(e -> e.getCity().equals("Seattle"));
// We are interested in grouping firstname and phone numbers now
JavaRDD<Person> groupedResult = seattlePeople.groupBy(e -> e.getFirstName().toLowercase()+e.getPhone()).values();

Now both of these operations that we performed are transformation, so nothing has yet been executed. Things get executed only when an action is taken. Suppose, now we want to collect the data from all the RDDs distributed across multiple data nodes, we can simply do:

List<Person> result = groupedResult.collect();

Few things are pretty handy. In the above code, we converted an RDD into a Java List. Similarly if you ever want to convert a Java List into a Spark RDD, you can do:

JavaRDD<Person> personRDD = sparkContext.parallelize(result);

Now that we have this processed data, you can do what ever you want to do with it. Save it to a file, save it to a DB , write it to a queue etc.

Spark Sql

Spark SQL is an apache spark library that provides data abstractions on which we can perform SQL like queries. Previously I introduced you to how RDDs store the data from different sources. Similar to RDDs, Spark SQL has concept of Datasets and Dataframes.

Dataset:  Datasets added from spark 1.6 built on top of RDDs provides all benefits of RDDs and all transformations that can be performed on RDDs along with the added benefit of using Spark SQls optimized execution engine.

Dataframe: Dataframe are set of datasets organized into columns. Conceptually its very similar to an SQL based database table.

 Usage:

In order to use sql like features, you will have to initialize spark’s SQL context. That can be done by:

SQLContext sqlContext = new SQLContext(sparkContext);

Once you have the sqlContext, you just need to connect to the source now. Lets see how that can be done.  I have come to love mongodb, so I am going to be using another mongo connector that provides an easy api to connect to mongodb.

Connecting to the source:

I am using another mongodb connector for this purpose, you can easily add this using:

<dependency>
 <groupId>com.stratio.datasource</groupId>
 <artifactId>spark-mongodb_2.10</artifactId>
 <version>0.10.0</version>
</dependency>

Now that we have this dependency in place we can connect using:

 DataFrame peopleDF = sqlContext.read().format("com.stratio.datasource.mongodb").options(options).load();

where options is just the mongodb connection configurations:

Map options = new HashMap<>();
 options.put("host",mongodbHost);
 options.put("database",database);
 options.put("collection",personCollection);

Now that we have the dataframe consisting of all the records we can perform SQL like queries to filter out people living in Seattle using:

 DataFrame seattlePeople = peopleDF.filter("city = 'Seattle'");

After filtering we now have to group our records thats very simple and intuitive:

seattlePeople.registerTempTable("seattlites");
DataFrame groupedResult = sqlContext.sql("SELECT firstName,phone,COUNT(*) FROM seattlites GROUP BY firstName,phone);

Now that we have our grouped result, we can easily see the result using:

groupedResult.show();

Incase you want to see only firstName you can do:

groupedResult.select("firstName").show();

In case you are just interested in seeing the resultant schema, you can do:

groupedResult.printSchema();

Hope that I have not overwhelmed you guys with all of this information. This was a very quick Spark 101 usage. Let me know any doubts, questions or suggestions.

Evaluation of Big Data Processing Frameworks – A Series

Big data and related technologies have developed quite rapidly in the recent years. With fast paced development tons of big data processing libraries have mushroomed. Lot of libraries have gained some traction while others have been left behind. In this series I would like to share my experience with few of these libraries and discuss our real world use-case.

Before we begin, I would like to clarify what I like to refer big data as. It is data which has 3 V attributes.

  • Volume
  • Variety
  • Velocity

Large quantities of data which may or may not have a fixed schema getting generated at a very high speed is big data. This data can be website traffic logs, data from connected devices as part of Internet of things or data being generated by airplanes flying in the air that’s continuously being relayed to ground stations.

Enough of introduction into what big data is. Now lets see a high level overview into what a big data processing framework needs to have. In a nutshell, there are 3 very simple things:

  • Source
  • Processor
  • Sink

Source

A good big data processing framework should be able to connect with an array of different sources. Sources can be in the form of databases which can be Sql or NoSql based databases, flat files, message brokers or maybe even a simple HTTP REST endpoint where data can be continuously POSTed.

In order to be a successful library they need to have drivers/connectors that can connect to most of the leading databases like Oracle, MySql, Postgres, MongoDB, Cassandra, HBase etc. Not a lot of these connectors are available out of the box with the library so community support is very important to develop connectors for some of these sources.

Processor

One of the big features that most of these big data processing frameworks bring to the table is the distribution. Not only is the data distributed across multiple nodes but a simple process can be broken down int several tasks where each task can then be independently processed by different threads or machines in a cluster. After the data is processed across several threads or nodes depending on whether its a single node configuration or a cluster configuration, the processed data is then collected and presented as result. Most common processing operations that we do is a Map ( alter the structure of data into a much more simpler format or create a list of values after processing some input data ) and then Reduce ( do some aggregation on the mapped list) and produce a result. many frameworks allow you to join data from multiple different sources into some temporary data stores. For instance Apache spark allows you to join data from a queue with data coming from a database. There are many other powerful operations like wrap , fold etc. which generally are provided by most of the frameworks.

Sink

Sink has requirements more or less like Source. The processed data needs to be written out. So the framework should support the functionality of writing to different datastores/ message brokers.

The journey of data through all these different steps is often referred to as a pipeline. A pipeline generally involves one/multiple sources and sinks and may also have one or several processing steps depending on the use case and complexity of the task.

Big data processing pipeline

Now that we have a general idea of what any big data processing framework is expected to do, lets dive in and take a closer look at some of the most prominent big data processing libraries that are available and some of the concepts that they promote. In the next post I will provide a brief introduction into some basic concepts of Apache Spark. Stay tuned.

Spring XD Assessment

Last week we had a business use-case to support several ETL operations. Most of the operations read from JDBC source and then write to different sinks like Mongo or Kafka or HDFS. Spring X D seemed a very neat solution that needed less/almost no coding. However we soon hit a deadlock as what we wanted was somehow not getting addressed. However in this post, I would like to write about how we can quickly get started with spring X D.

Installation

Installation of SpringXD is pretty simple. All you need to do is make sure that you have Java SDK installed in your machine and have JAVA_HOME set, so that spring X D can find it. Once you make sure that you have JAVA setup, all you need is to download: SpringXD distribution.

Whats Spring X D

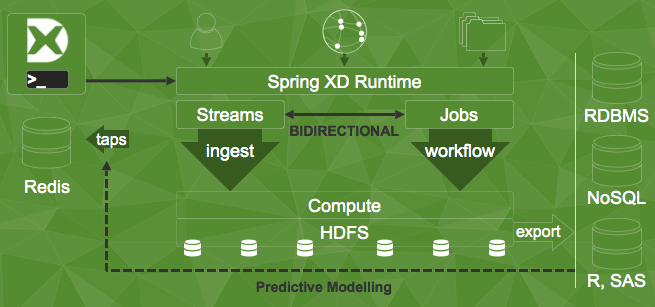
Spring X D is a nice unified platform that can be used for Stream and Batch processing. Spring X D packs in several spring projects that you use in your day to day life like Spring MVC, Spring Data, Spring Batch, Spring Integration etc.

XD1.png

Getting Started

1. Unzip the Spring X D Distribution folder. You should see the following subdirectories:

  • LICENSE
  • README
  • docs
  • gemfire
  • hsqldb
  • python
  • redis
  • shell
  • x d
  • zookeeper

I am using Spring X D’s 1.3.1.RELEASE version. To get started navigate to the x d folder.

2. To start off tour spring X D project. go to x d/bin. Run xd-singlenode . This is a nice bash script that starts up a single node instance of Spring X D.

 3. Now before you move ahead, look at what the configs are. The configs that load up by default are present in x d/config/servers.yml

If you want to just run the standalone instance in one environment you can go and uncomment the relevant sections in there. You can change the jdbc source configs, like change the hostUrls, add secrets and mention driver name. You can set up the kafka and zookeeper configs too.

4. However more often than now you will have multiple environments like dev, QA and prod.  In order to make the configs environment specific, you can create

servers-{envName}.yml

Spring X D is a spring boot app, so you can expose the environment like expose SPRING_PROFILES_ACTIVE=envName.

5. You can quickly start up the Spring X D shell by going to shell folder on the root and do /bin/xd-shell to start up the shell.

6. Once you get in to the shell you can do:

stream create –definition “time | log” –name ticktock –deploy 

Here you just created a Stream thats going to log the System time every second. This is a Spring X D DSL where time is the source and log is the sink. Name of this stream is ticktock.

The pattern that Spring X D uses is source|process|sink.

7. The way the DSL works is that, Spring X D has several already inbuilt modules for source and sink. To find out what go to : XD/modules/. You will see:

  • common
  • job
  • processor
  • sink
  • source

You can now deep dive into each of these folders and see what all support spring X D has. For instance, you will have time module inside the source folder and log module in the sink.

8. Sample DSL for a task which requires moving data from JDBC based SQL databases to Mongo:

stream create –definition “jdbc –url=jdbc:hsqldb:hsql://localhost:9101/mydb –query=’select * from testfoo’ | mongodb –databaseName=test –collectionName=names”

9. When you create a Stream or a Job, Spring X D gives a nice Admin UI where you can see all the streams that have been created, their deployment state and you can also un-deploy streams/jobs from the UI. Generally you will find the admin UI running on port: 9393.

That’s it for now. In the next post I am going to discuss about how to interact with Spring X D from your spring boot app, API support, creating custom modules, registering jobs and much more.

If you are wondering why I have a space between X & D, its because wordpress is converting X D into emoticon 😦

Stay tuned. !!

Hadoop 101 : Hadoop Installation on MAC OS and First Hadoop program

Preface:

Hadoop has been on my radar for a long time now. But I didn’t quite find time and motivation to start off. I have made multiple attempts over last 3 years but always found some excuse to leave it midway.

This time however I finally installed a single node Hadoop cluster on my local machine and could run a very simple program. I did have some hiccups while running the program, but they were mainly because I didn’t think through.

Let me just start off by elaborating on the Hadoop installation.

Hadoop Installation guidelines:

Pre-requisites:

1. Mac OS X 10.9.5

2. Java 1.7 SDK installed


Installation Steps:

1. Install Homebrew:

$ ruby -e "$(curl -fsSL https://raw.githubusercontent.com/Homebrew/install/master/install)"

2. Install Hadoop:

$ brew install hadoop

Configuration Steps:

1. Go to:  Hadoop -env.sh

It can be found at:   /usr/local/Cellar/hadoop/2.6.0/libexec/etc/hadoop/hadoop-env.sh ( 2.6.0 is my hadoop version here )

Find:

export HADOOP_OPTS="$HADOOP_OPTS -Djava.net.preferIPv4Stack=true

Replace it with: 

export HADOOP_OPTS="$HADOOP_OPTS -Djava.net.preferIPv4Stack=true -Djava.security.krb5.realm= -Djava.security.krb5.kdc="

2. Go to:  core-site.xml

It can be found at:   /usr/local/Cellar/hadoop/2.6.0/libexec/etc/hadoop/core-site.xml ( 2.6.0 is my hadoop version here )

 <configuration>
  <property>
     <name>hadoop.tmp.dir</name>  
<value>/usr/local/Cellar/hadoop/hdfs/tmp</value>
    <description>A base for other temporary directories.</description>
  </property>
  <property>
     <name>fs.default.name</name>                                     
     <value>hdfs://localhost:9000</value>                             
  </property>                                                        
</configuration> 

3. Go to:  mapred-site.xml

It can be found at:   /usr/local/Cellar/hadoop/2.6.0/libexec/etc/hadoop/mapred-site.xml ( 2.6.0 is my hadoop version here )

<configuration>
       <property>
         <name>mapred.job.tracker</name>
         <value>localhost:9010</value>
       </property>
 </configuration>

4. Go to:  hdfs-site.xml

It can be found at:   /usr/local/Cellar/hadoop/2.6.0/libexec/etc/hadoop/hdfs-site.xml ( 2.6.0 is my hadoop version here )

 <configuration>
    <property>
      <name>dfs.replication</name>
      <value>1</value>
     </property>
 </configuration> 

Now that configuration is done lets see how we can start and stop the hadoop services.


SSH Configuration:

Generate SSH keys by:

$ ssh-keygen -t rsa

Go to system preferences —> Sharing —> Remote Login and check the option to allow for ALL USERS.

Now make your systems aware of the keys by:

$ cat ~/.ssh/id_rsa.pub >> ~/.ssh/authorized_keys

If everything is great with the keys, you should see something like this:

$ ssh localhost
> Last login: Sun Apr  5 14:30:53 2015

Starting / Stopping Hadoop Services

Before proceeding further ahead. Lets start with a clean slate by formatting our HDFS instance by:

$ hdfs namenode -format

For Starting:

Starting HDFS:

"/usr/local/Cellar/hadoop/2.6.0/sbin/start-dfs.sh;

Starting Map-Reduce Services:

/usr/local/Cellar/hadoop/2.6.0/sbin/start-yarn.sh"

For Stopping:

Stopping HDFS services:

"/usr/local/Cellar/hadoop/2.6.0/sbin/stop-dfs.sh;

Stopping Map-Reduce Services:

/usr/local/Cellar/hadoop/2.6.0/sbin/stop-yarn.sh"

Our first Hadoop program

I am going to cheat here and copy an already running project: ( Thanks to drdobbs )

 git clone git://github.com/tomwhite/hadoop-drdobbs.git

This is simplest of the projects where the input data is a list of words and a detail on how many times these words have repeated in multiple books for specific years.

If you take a look at the ‘data’ folder in the project, you will find a tsv file that has tab seperated values:

% cat data/*.tsv
dobbs	2007	20	18	15
dobbs	2008	22	20	12
doctor	2007	545525	366136	57313
doctor	2008	668666	446034	72694

What this simple map-reduce job is going to do is, its going to provide us an aggregate of how many times each of these words have repeated over time.

To perform this operation we are going to have 3 files:

1. ProjectionMapper.java [ This is the mapper file that goes ahead, reads the file and converts it into key values pairs ].

The sole job of the mapper is to make key value pairs. So the expected key-value pairs from the mapper would be:

Key : “Word”      Value: “Count”

The Hadoop mapper interface takes in an input key-value pair and outputs a key-value pair.

public class Mapper<KEYIN, VALUEIN, KEYOUT, VALUEOUT>

So in our case we just have the value i.e. the document file to send as an input. And the output would be the above mentioned key-value pair. The Word is of type string and the counts should be of type Long, but Hadoop always requires the data type to be serializable. So we use Text and LongWritable as the data types.

Signature of the mapper:

 protected void map(LongWritable key, Text value, Context context)

The projectionMapper implementation is quite simple, we just read the file split it into string array based off the tab spaces and set the text and LongWritable types. Once that is done we write the map output into a Context.write method.

2. LongSumReducer.Java [ The reducer fie that does the aggregation task ]

Hadoop transforms the output from the mapper and groups the keys so the input that goes to the reducer would be something like this:

("dobbs", [20, 22])
("doctor", [545525, 668666])

LongSumReducer is an Hadoop inbuilt class that basically looks at each key and then sums up the values that belongs to the key together.

Signature of the reducer:

public void reduce(KEY key, Iterable<LongWritable> values,
                     Context context)
The reducer signature is different from mapper since the reducer is expecting a List of values to iterate over and aggregate.
3. AggregateJob.java [ The main method that specifies what the mapper and reducer classes are and has a main method that uses Hadoop’s toolRunner to run the jobs.

Running the Hadoop Program

We need to create a user directory in the hdfs first. This can be achieved by:

hdfs dfs -mkdir /user

Next we need to create a directory for the particular user:

hdfs dfs -mkdir /user/chattod

Now we need to move our input data folder ‘data’ to the HDFS data node:

hdfs dfs -copyFromLocal /Users/chattod/Hadoop/hadoop-drdobbs/data /user/chattod/data

Now that we have moved the data into hdfs we can do a -ls and see if the file has really been transferred:

hdfs dfs -ls /user/chattod/data

The hadoop program can be built by first doing :

mvn install

This is going to generate a jar file in the target folder.

To run the program:

/usr/local/Cellar/hadoop/2.6.0/bin/hadoop jar target/hadoop-drdobbs-1.0.0.jar com.tom_e_white.drdobbs.mapreduce.AggregateJob data output

 Here we send in two arguments data and output. Hadoop is going to look for data folder in HDFS and its going to create an Output folder in HDFS. The data folder needs to be in HDFS for the program to execute, otherwise you will be getting errors like file not found.

Now you can run:

hdfs dfs -cat /user/chattod/output/part-r-00000

to look at the output result that the map-reduce program has created for you.

Enjoy your first map-reduce project !! ..:)

No SQL databases …. Humm what are they? and why should I be using them?

NoSQL databases are being talked of a lot now a days and there are a number of commercially available NoSQL databases. The question now arises to what these NoSQL databases are and why would anyone want to use them. To answer this question lets look behind into the history of databases and find out how the no sql databases became popular.

Rise of relational databases (SQL based) started in the early 1980’s. They brought a lot of benefits with them, which made it one of the in disposable tools. Firstly they introduced this simple query based language to create, insert , read, delete and host of other operations. They were easy to integrate with applications. They could manage concurrency for simultaneous transactions and organize data in simple tables with rows and columns. In addition theses relational databases provided persistence and easy report generation. All these benefits provided by relational  databases made them the industry choice and made SQL the defacto language for any database related interaction.

Alright !!, so if relational databases provide us everything why do I needs a NoSQL database. Well with all the benefits that relational databases provide us, there are a few shortcomings.Most of the applications developed assemble objects in terms of a cohesive whole things where we might integrate data from multiple smaller tables. To be more clear, suppose I want to create a simple customer profile page which just consists of the customer’s personal details, in addition to his wishlist, purchase history and credit card details. Now in this case when we create a plain POJO( if its a java application) for customer profile page we put in the name, address, wishlist, card details etc. all into one java class. In the databases however, all this information is stored at multiple tables and maybe in multiple databases. So when the user want’s to create his personal profile, the data stored in the objects that capture the user information need to be stripped out and stored at multiple tables. So what basically happens is that a very simple logical structure gets splattered across lots of rows and tables.We use various ORM tools commonly to now map these objects to the database.

So now many of you might think there has to be a better way then using mapping, why not directly store objects. One of the main reasons object based databases did not come up in the 90’s or in early 2000’s is that SQL databases provided a very efficient way of integration between different applications.However things have changed a lot now, after the humongous data growth. SQL databases were developed essentially for a single node, and there was a limitation on how large this node could be. As the data kept growing, focus shifted from single node databases to multi-node distributed databases.A lot was done to adapt the relational databases for clusters, however they always seemed to have some shortcomings. So the momentum grew for NoSQL databases.

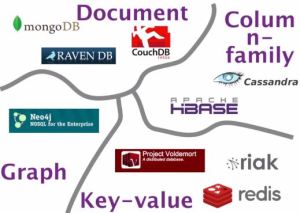
Some of the clear characteristics of NoSQL databases are that they are non-relational, scale able, open source and schema-less. However all the NoSQL databases are not the same. They tend to differ in their data model. Some of the most common NoSQL databases seem to be document stores, key-value pair stores, data stores that store graphs and data stores that have column based indexing. This is very well illustrated in the slide from Martin Fowler.

Capture                                                                              Reference: Martin Fowler

 The simplest data model to consider is the key-value pair based data model, where data is store based off a key. Its kind of like a hash-map where you give the key and the required data is returned, it doesn’t care on what is stored based off the key. The next kind of data model to consider is the document based data model, where you have a large chunk of complex data representing a whole thing. In our previous example about customer profile page, it may very well be the case where we have all the information recorded and stored in a document. In most of the cases these documents tend to use JSON, since that carries less metadata and is easy to understand and transfer. Usually all these documents are searchable and do not pertain to a single schema.Well that said these two data models are a lot similar. Key-value based databases allow you to store some metadata, which is often in the form of Id’s. So in the case of the customer profile page the key-value database will store metadata in the form of customerID. Now this is the same way in which a record is searched in a document based database. Every document generally has an Id field and most of the lookups are done based off these Ids. So we say give me all the details for customer with Id equal to something.

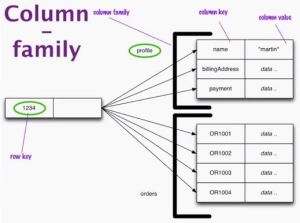
 Now the next thing to discuss is the column based data model. They are a bit more complex than the earlier two models that we have seen. Here is what it is. Capture                                                                                                                            Reference: Martin Fowler

 So in the column-family based databases what we have is a row-key that is paired with a column family. So in the example above we retrieve the name of the individual record by 1234-profile.name. This structure allows for faster retrieval. In all these above discussed NoSQL databases one common underlying fact is that, everywhere we store data for one whole aggregate. In our example we always store data for a customer profile page altogether rather than having all the individual pieces of data scattered over multiple places. This is called as aggregate model by Martin Fowler.

Now graph databases are not aggregate based databases like the other three. They really are databases that are good at maintaining relations. They can solve queries like friend of A who likes B living in town C. These kind of queries are extremely difficult for relational databases. Such kind of queries are solved by graph databases.

Now its wrong to say that SQL databases are good for nothing. Say, if we wanted to query list of all products available in a store, then a relational database will do best, our aggregate based  databases will be a no match. So it essentially boils down to your applications needs.

Recently there has been a lot of focus on very quick lookups. Elastic search is one of the most frequent used search framework built on top of Apache Lucene. Elastic search too has a concept of reading data through a data source like a file system that can be easily mounted. Does that mean that elastic search as a framework can be considered as an option for a no-sql database ? Well it actually depends on the application needs again. Here is a very neatly written concise article explaining the same concept: https://www.found.no/foundation/elasticsearch-as-nosql/ 

Lets continue further discussion in the subsequent posts. Have a good time reading ..:)

Enterprise Service Bus and Service Oriented Architecture

Definition:

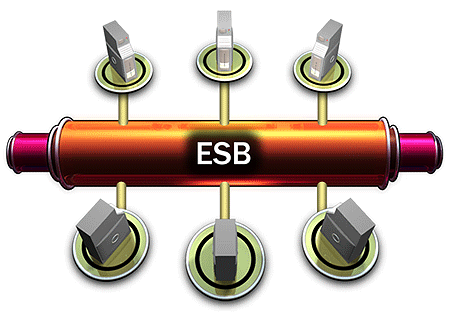
Enterprise Service Bus often well known as ESB is a Software development architecture model that is used as a mediating layer, for communication between applications running in different subsystems based on Service Oriented Architecture.

Overview and Use Case

In today’s world most of the successful businesses are all service based, meaning that they operate by providing services to consumers who are you and me. As the days pass by, we are becoming more and more dependent on technology as we want services not only to be best in quality but also on time. Technology especially information technology has enabled big organizations to reduce this time by significant amounts. Every day technology evolves to provide these services more faster and better. Complex tasks that are quite routine can be handled more efficiently by a computer than by a human being. Clearly computers are beating humans in their own game.

It is not possible for a single system to perform all the complex tasks, therefor the task is broken down into different sub tasks and dedicated systems are delegated to perform specific tasks. Each system specializes in something, like a mathematician will be best in solving equations but may not be best in solving chemical equations. All these systems now need to talk to each other to accomplish a common goal. But these systems may talk in different ways, like the mathematician may speak English but the chemist may speak Japanese. Therefore an interpreter is needed who understands both these languages and can make sense out of it. This job of communicating between different systems that are specialists in their own domains is done by an ESB or Enterprise Service bus.

Communication between different systems can be achieved by many ways like  web services , JMS queues or even through File transfer. The usage of any of these communication mechanisms depends on the use case. If in-case the data being communicated between systems is very important and failure rates need to be very low then persistent JMS queues can be used, while if the requirement is to provide a communication mechanism that involves instantaneous request-responses then a synchronous web service may be used. If the information that is being transferred between systems is huge and cant be handle by a web service or a queue, then a file transfer using FTP protocol can be done.

An enterprise service bus is a box ( Container ) that has many technologies bundled in it that can handle all these ways of data communication, can transform messages, can start and stop flow of messages as and when required. FUSE ESB or JBOSS ESB is one such enterprise service bus that is commercially used in a service oriented software development model.

More information on FUSE and its technologies will be provided in the subsequent posts.

Till then, enjoy reading ….